

The 8-foot putt success rate is based upon measured putts in tournament play. To be fair, this is helpful because the putts are executed under meaningful conditions for the players. Therefore, these data provide are flection of their tournament skills under pressure, which is interesting information to analyse.
I could continue, but you get my point.

The obvious argument against the point I’m making is that a large sample of putts are measured, and so the hope would be that the impact of varying influential factors would even out over time.
I understand this perspective and it’s true that PGA Tour players will hit many putts over the course of a season. However, they won’t actually hit that many from 8 feet.
For example, the Argentinian Emiliano Grillo is the current statistical leader in putting from 8 feet, having made 69.23% of his putts. He has only had 52 putts from this distance all season, making 36.
Other notables; Shane Lowry has only had 36 putts in total from 8 feet (making 23, 63.89% success rate). Rory McIlroy has had 37 putts all season from 8 feet (making 19, 51.35% success rate).
Grillo, Lowry and McIlroy have played 22, 18, and 14 events on Tour this season respectively. Therefore, each player will have, on average just over 2 8ft putts at each tournament (of course, averages are deadly, so at some tournaments they will have more and at others they’ll have zero!).
Let me stop spouting off numbers and get to my point.
The next time we are watching Emiliano Grillo on the PGA Tour and he steps over an 8ft putt, what does his 69.23% season success rate actually teach us to expect? I would argue it tells us to expect him to hole more putts on average than every other player on Tour, but not much else because we don’t know enough about that specific putt.
Trackman 4 allows us to gather averages for every metric. personally like using the Shot Analysis mode to collect my average yardages for every club in the bag.
However, I do so knowing the truth about averages; an average is a guide.
For example, say you hit 5 7-iron shots. Each shot carries 135,142, 149, 152, 156 yards respectively. Your average is 146.8 yards. But how many shots did you actually hit 147 yards? Zero.
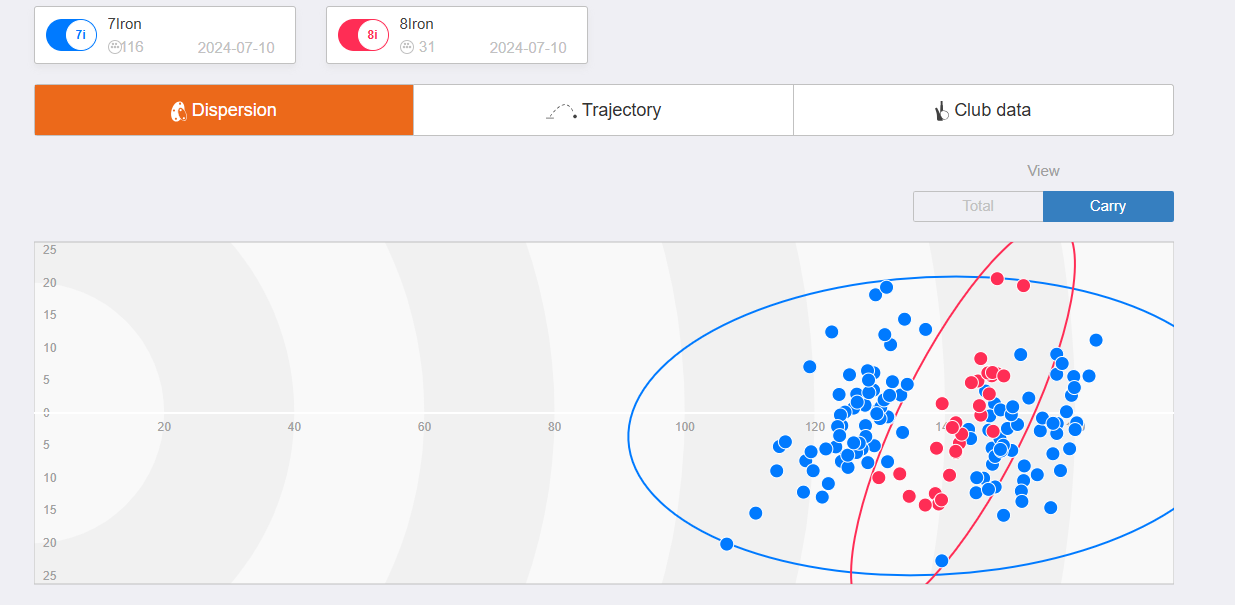
The benefit of practicing using the Shot Analysis mode on Trackman that it gives you the ability to be able to collect individual data points (not just averages), that can be presented in a report and sent directly to your email account.
Much like the ‘Putts from 8ft’ statistic, averages help give us a snapshot of a golfer’s ability, but they are no substitute for the raw, multi-faceted data itself. The raw data Trackman provides gives you the full picture, and the basis to make smarter decisions and observations about your own game.